
TL;DR

Play games on Amazon Luna for your game nights, included with Prime
- A rotating selection of games, no download needed
- Play on TV, laptop or phone
- Fast, free delivery for your gear, too
An XDA Developers writer saw a 2TB XPG GAMMIX S70 BLADE’s write throughput fall sharply after 19 seconds during a sustained transfer. The drive’s advertised 6,800 MB/s figure describes short-burst performance; its dynamic SLC cache filled after roughly 117GB, and subsequent writes were slower. The result is one drive’s test, not a measurement of all SSDs.
An XDA Developers writer reports that an XPG GAMMIX S70 BLADE 2TB NVMe Gen4 SSD, advertised with write speeds of up to 6,800 MB/s, dropped to roughly 1,000–3,000 MB/s during a sustained transfer after about 19 seconds. The account illustrates why a drive’s headline speed may not describe long writes: the drive’s dynamic SLC cache can temporarily absorb data at high speed, then fill and give way to slower native TLC writes.
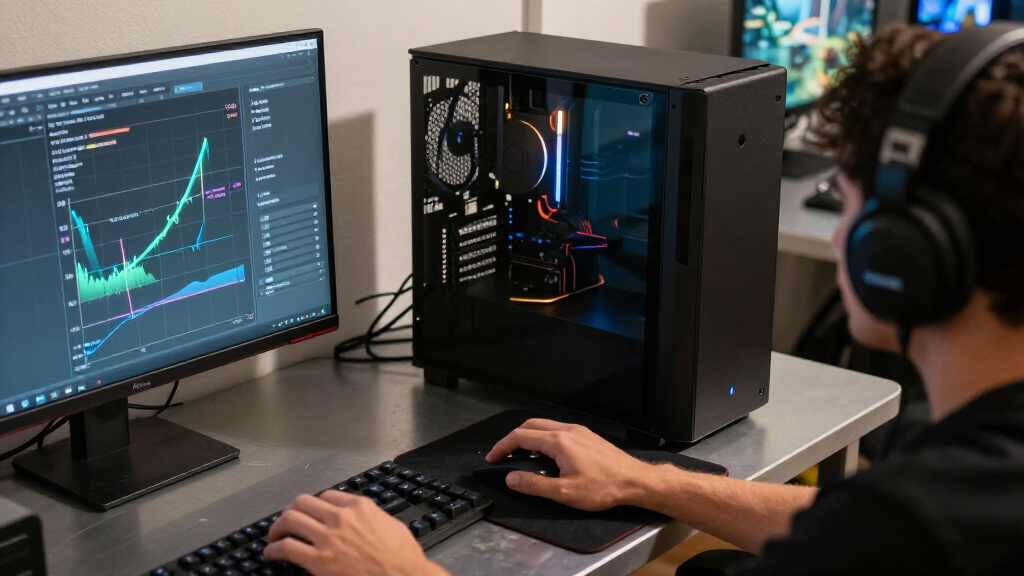
The writer says the test copied a 235GB media-server folder between partitions on the same physical drive. Throughput initially reached about 6,000 MB/s, then fell sharply after 19 seconds. The article estimates that the drive had about 117GB available for its fast cache before the slowdown became apparent. Those figures describe this writer’s drive and test; they are not a controlled comparison across SSD models.
The tested SSD uses TLC NAND and has a DRAM cache, according to the account. The SLC write cache is a separate feature: the drive temporarily uses some NAND cells in single-bit mode to accept writes more quickly. Once that cache is exhausted, incoming data is written at the drive’s slower native pace while its controller folds cached data back into TLC storage.
The report says the tested drive had about 24% of its 2TB capacity free. Dynamic SLC cache size can vary with available NAND space, so a more occupied drive may have less room for this fast-writing mode. The writer used HD Tune Pro’s File Benchmark and cautions that a zero-filled test pattern can produce misleading results on some drives. The article also warns against using the program’s main Benchmark write test, which it says can erase existing data.
Storage · Sustained Write Performance
My SSD Hit a Speed Cliff After 19 Seconds
One 2TB XPG GAMMIX S70 BLADE began a large file transfer near 6,000 MB/s, then slowed sharply when its dynamic SLC cache filled. The result shows why a burst speed does not tell the whole story of long writes.
01 / What happened
A burst gave way to a slower pace
The writer copied a 235GB media-server folder between partitions on the same physical drive. Throughput initially reached about 6,000 MB/s, then fell into an estimated 1,000–3,000 MB/s range after roughly 19 seconds.
Start fast
Incoming data lands in NAND operating in SLC mode.
Cache fills
About 117GB of fast cache was estimated for this test.
Speed drops
New writes proceed at the drive’s slower native TLC pace.
Drive folds data
The controller moves cached data back into TLC storage.
02 / The reported pattern
Why the headline number has an asterisk
The 6,800 MB/s figure describes a maximum burst write speed. The article’s observed transfer began around 6,000 MB/s, then settled substantially lower once the available fast cache was exhausted.
Illustrative throughput pattern · not raw benchmark data
Dynamic means variable
The drive reportedly had about 24% of its 2TB capacity free. Dynamic SLC cache can shrink as a drive fills, so the same cache size is not guaranteed at every fill level.
TLC is the native pace
The tested SSD uses TLC NAND and DRAM. Its SLC write cache is separate: NAND temporarily stores one bit per cell for faster writes, then data is folded into TLC storage.
03 / When it matters
Long writes reveal what short bursts hide
A maximum sequential speed can help describe short activity. It cannot, by itself, show how quickly a drive writes after its cache runs out.
Large, sustained jobs
Media projects, backups and repeated large-file transfers are more likely to exceed cache and expose slower native writes.
Typical gameplay
Games mainly read from storage. This test measured long writes, so it offers limited reason for gamers to worry on its own.
Look beyond peak speed
For write-heavy workloads, compare sustained-write results and cache behavior alongside headline sequential specifications.
04 / Evidence and limits
One drive test, with open questions
What the report describes
- ✓ One 2TB XPG GAMMIX S70 BLADE NVMe Gen4 SSD.
- ✓ A 235GB folder copied between partitions on that same physical drive.
- ✓ HD Tune Pro File Benchmark; the writer cautions that zero-filled patterns can mislead on some drives.
- ✓ An estimated 117GB of cache and roughly 24% capacity free at test time.
What it does not establish
- ~ No controlled comparison across SSD models or independently replicated results.
- ~ Firmware, system configuration, source behavior and full benchmark settings are not specified.
- ~ No complete throughput series across fill levels or quantified cache-folding impact.
- ~ The 19-second point is not a prediction for other drives or every workload.
05 / Reader guide
How to check your own drive
A file-based write test can reveal a cache limit if it is large enough to exceed that drive’s cache. The source’s 235GB test size is specific to that drive and should not be copied blindly.
Choose a file test
Use a file-based write benchmark with a suitable mixed or random data pattern.
Check free space
Confirm the selected partition has enough available room for the test file.
Watch throughput
Track speed over time and look for a sustained change after the cache fills.
Test sparingly
Writes consume some endurance. Avoid repeated runs and potentially destructive modes.
The writer specifically warns against HD Tune Pro’s main Benchmark write test, which may erase existing data.
06 / Key questions
What the slowdown does and does not mean
Does this mean the SSD is faulty?
No fault is established. The account presents the slowdown as behavior after the fast SLC cache filled, not proof of a defect.
Will every SSD drop after 19 seconds?
No. Cache size and sustained speed vary by model, capacity, free space, temperature and workload.
Should gamers worry?
Usually not from this test alone. Gameplay mainly reads data; long writes are more likely to expose the difference.
Is a sustained-write test safe?
Use a file-based test carefully, avoid potentially destructive benchmark modes and do not repeat it unnecessarily.
Why Long Writes Slow Down
The reported drop matters most to people who regularly move or create large files in sustained bursts, such as media projects, backups or other workloads that exceed a drive’s cache. A product-page maximum may be a useful indicator of burst performance, but it does not by itself show how quickly the SSD will write after its cache fills. Buyers comparing drives may need sustained-write results and cache behavior, not just the highest sequential-speed number.
For ordinary gaming, the report offers less cause for concern. Games mainly read data from storage, and installing a game does not necessarily involve one uninterrupted write of the full download size. The observed slowdown is more relevant to long writes than to typical gameplay, though other tasks can involve sustained writes too.
2TB PCIe 4.0 NVMe SSD sustained write speed TLC DRAM cache
As an affiliate, we earn on qualifying purchases.
As an affiliate, we earn on qualifying purchases.
The Cache Behind the Speed
Consumer SSDs commonly use TLC or QLC NAND, which store three or four bits per cell. Storing more bits can lower the cost per unit of capacity, but writing those cells is slower than writing a cell in SLC mode, which stores one bit. Drives use part of their NAND as an SLC cache to combine fast short-term writes with higher-capacity TLC or QLC storage.
Some drives use dynamic SLC caching, borrowing available space from NAND rather than reserving a single fixed cache size. The XDA account says its drive had roughly 117GB of cache available at the time of the test. This is specific to the drive’s capacity, fill level and test conditions; the report does not establish a standard cache size or slowdown point for other models.
“All it took was 19 seconds for that speed to dip hard, and go all the way down to somewhere between 1,000 MB/s and 3,000 MB/s.”
— Samarveer, XDA Developers writer
2TB Gen4 NVMe SSD high sustained write performance
As an affiliate, we earn on qualifying purchases.
As an affiliate, we earn on qualifying purchases.
Limits of One Drive Test
The account does not identify the SSD’s firmware version, test-system configuration, source-drive behavior or detailed benchmark settings beyond the stated test pattern and file size. It also does not provide independently replicated results or a controlled comparison with other SSDs. The reported 19-second point and roughly 117GB cache estimate should therefore be treated as observations for this particular drive and setup, not as a prediction for all XPG models or NVMe SSDs.
The article does not provide a full set of sustained-write measurements at different fill levels, nor does it quantify how much the controller’s cache-folding activity affected the observed throughput. Exact performance will vary with drive model, capacity, free space, temperature and workload. The source does not establish whether the product’s listing omitted sustained-write information or whether comparable figures appeared elsewhere in its specifications.
M.2 NVMe SSD heatsink for PCIe 4.0 SSD
As an affiliate, we earn on qualifying purchases.
As an affiliate, we earn on qualifying purchases.
How Readers Can Check Their Drives
Readers who want to check their own SSD can use a file-based write test large enough to exceed the drive’s cache, while monitoring throughput. The XDA writer used HD Tune Pro’s File Benchmark with a random or mixed data pattern and a file length large enough to expose the slowdown. The writer says their test needed a 235GB file; that size should not be assumed to fit every drive or cache.
Before testing, users should confirm the selected partition has enough free space and avoid tools or modes that may erase data. The report cautions that sustained writes consume some drive endurance, so the test should be run sparingly rather than repeated for a graph. No follow-up measurements or manufacturer response were included in the source material; whether further testing will confirm the result remains unknown.
USB 3.2 Gen 2×2 NVMe SSD enclosure
As an affiliate, we earn on qualifying purchases.
As an affiliate, we earn on qualifying purchases.
Key Questions
Does this mean the SSD is faulty?
No fault is established by the report. The writer describes a sharp slowdown after the drive’s fast SLC cache filled, a behavior presented as a feature of the drive’s storage design rather than proof of a defect.
Why did the drive slow down after starting fast?
The drive temporarily wrote data to NAND operating in SLC mode. After the available cache filled, new writes went to the drive’s native TLC storage, which the article says is slower for sustained writing.
Will every SSD hit the same speed drop after 19 seconds?
No. The 19-second result came from one 2TB drive, with its particular free space and test conditions. Cache size and sustained performance vary by model, capacity, fill level and workload.
Should gamers worry about this result?
Usually not based on this test alone. Games mostly involve reading data, while the reported slowdown occurred during a sustained write. Large file transfers and other lengthy write workloads are more likely to expose the difference.
Is it safe to test my SSD’s sustained write speed?
A test can be run carefully, but it creates writes and consumes some drive endurance. The source recommends using a file-based test, avoiding its potentially destructive main Benchmark write test, and not repeating the test unnecessarily.
Source: XDA Developers
Fall Picks
fall essentials
As an affiliate, we earn on qualifying purchases.