
TL;DR
An XDA Developers writer reported that a Windows PC with 16GB of RAM was regularly using more than 80% of its memory and freezing during routine work. Task Manager showed only part of the picture; Process Explorer, Resource Monitor and Brave’s built-in task manager helped identify a browser tab as a major contributor, with no malicious process found.
An XDA Developers writer says a Windows PC with 16GB of RAM was regularly using more than 80% of its memory and freezing while opening documents or running Docker Desktop. After Task Manager failed to explain where the memory was going, she used Process Explorer, Resource Monitor and Brave’s built-in task manager to investigate; her account identifies the browser, including a content-management-system tab, as a major contributor and reports finding no malicious processes.

Play games on Amazon Luna for your game nights, included with Prime
- A rotating selection of games, no download needed
- Play on TV, laptop or phone
- Fast, free delivery for your gear, too
The writer noticed the problem after using PowerToys Command Palette, which displays system resource use. Although Task Manager marked the browser as the largest memory user, the most resource-intensive applications it listed added up to about 6GB of RAM. The PC had approximately 2GB hardware-reserved, but that still did not explain all of the reported memory use. Task Manager also did not make it easy for her to tell which browser tabs were consuming the most memory.
She turned to Process Explorer, a Microsoft Sysinternals utility that presents running processes in a different, more detailed interface, and to Windows’ built-in Resource Monitor. Process Explorer helped her spot Windows Resume using some memory; she says disabling a feature she did not use freed a small amount. Resource Monitor’s Memory tab showed categories including Hardware Reserved, In Use, Modified, Standby and Free. Together, the tools did not reveal malware: the writer says the processes she examined were normal system applications.
To narrow down the browser’s share, she opened Brave’s task manager, available through the browser menu or the Shift + Esc shortcut. It lists memory use by tabs and extensions as well as browser processes. The writer says the number of open tabs alone was not a reliable guide: some individual pages used much more memory than others. One content-management-system tab accounted for 1GB, according to her account. After trimming some apps and features, she brought overall memory use back into the 70% range, though she continued to focus on browser usage.
Windows troubleshooting · XDA Developers account
My PC Was Using Over 80% Of Its RAM, And These Tools Helped Me Figure Out Why
A Windows PC with 16GB of RAM was freezing during routine work. A closer look across system monitors and Brave’s built-in task manager pointed to browser tabs as a major contributor.
Finding the Memory Behind the Freeze
High RAM use alone does not prove a PC is malfunctioning. Here, the reported concern was high usage alongside freezes while opening LibreOffice documents or running Docker Desktop. Each tool showed a different part of the picture.
Task Manager
Flagged the browser as the largest user, but the listed applications totaled about 6GB and did not fully explain the reported usage.
Process Explorer + Resource Monitor
Process Explorer offered another view of running processes. Resource Monitor showed categories including In Use, Standby, Free and Hardware Reserved.
Brave Task Manager
Separated memory use by tabs, extensions and browser processes. One content-management-system tab reportedly accounted for 1GB.
From System Monitor to Browser Tabs
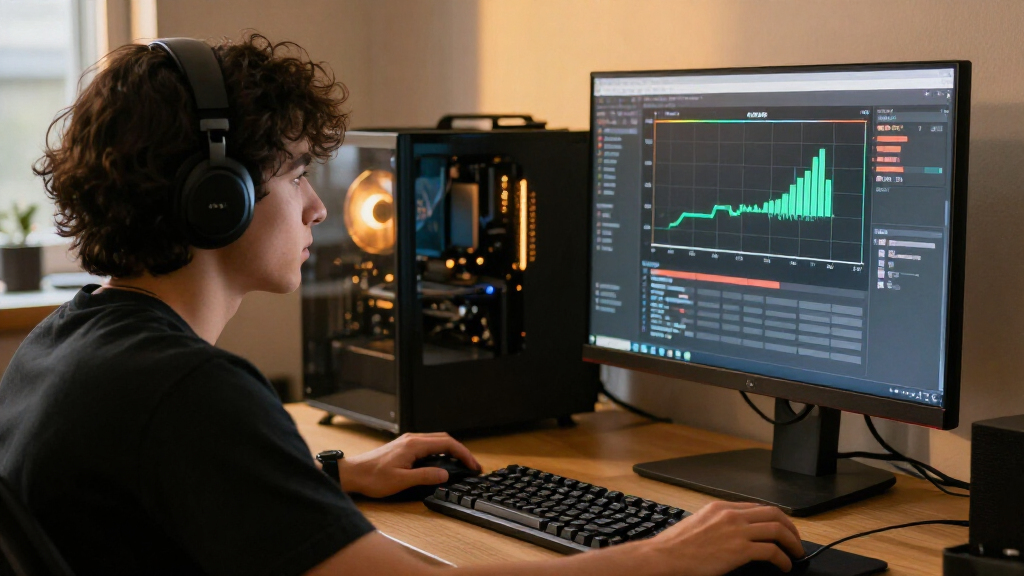
The investigation moved from an overall warning to narrower views. The writer says PowerToys Command Palette first made the persistent usage visible.
PowerToys showed RAM use repeatedly above 80% on a 16GB PC.
Task Manager identified the browser, while hardware-reserved memory complicated the totals.
Process Explorer and Resource Monitor added process and memory-category detail.
Brave’s task manager exposed tab-level use; individual pages varied substantially.
What Changed—and What the Numbers Show
After trimming some apps and features, the writer brought overall usage into the 70% range. She also says disabling an unused Windows Resume feature freed a small amount of memory.
Reported memory clues
Illustrative comparison of reported figures; the account does not provide a complete memory breakdown.
Three Quotes From the Investigation
“My PC was consistently using over 80% of its 16GB RAM capacity.”Megan · XDA Developers
“The browser was the real culprit.”Megan · XDA Developers
“The CMS tab I was using accounted for 1GB of memory.”Megan · XDA Developers
What the Account Does Not Establish
No complete breakdown
The account does not list memory use for every application, tab or extension, or establish the exact cause of total system usage.
No universal diagnosis
It describes one person’s experience, not a controlled comparison or a result that applies to every Windows PC.
No confirmed lasting fix
Usage fell into the 70% range after changes, but the writer did not report that the freezes were permanently resolved.
No proof of malware status
Finding no suspicious process in the tools checked is not the same as conducting an independent security audit.
Check Usage During the Next Freeze
Compare the readings while the slowdown is happening. Start with overall memory in Task Manager or Resource Monitor, inspect processes in Process Explorer, then check the browser’s own task manager if browser use looks high. Closing a confirmed heavy tab or disabling an unused feature can show whether the reading changes.
Press Shift + Esc
Brave’s task manager can also be opened from the browser menu. It lists memory use across tabs, extensions and browser tasks, according to the writer’s account.
Key Questions
Does using more than 80% of RAM mean a PC has a problem?
Not by itself. In this account, high use mattered because it appeared alongside freezes during routine tasks.
Why did Task Manager not explain the usage?
It showed the browser as the largest user, but the listed apps totaled about 6GB. The writer wanted more detail on reserved memory and individual tabs.
What did the Windows tools reveal?
Process Explorer helped identify Windows Resume using some memory. Resource Monitor showed categories such as In Use, Standby and Free.
Did the tools fully fix the PC?
The account reports reduced usage in the 70% range, but does not confirm a lasting resolution for the freezes.
Finding the Memory Behind the Freeze
High RAM use does not automatically mean a PC is malfunctioning. Windows uses memory for active applications and may keep data available for quick access. But in this account, the usage coincided with freezes and difficulty opening everyday work tools, making it useful to determine whether a specific app, background process or browser page was responsible.
The practical point is that one system monitor may not answer every question. Task Manager gave the writer a broad view, while Resource Monitor clarified how memory was classified and Process Explorer offered another way to inspect processes. A browser’s own task manager can then separate the cost of individual tabs from the browser as a whole. These checks helped the writer narrow the cause without treating a high percentage, by itself, as proof of malware or a need to upgrade memory.
Popular right now

KitchenAid Classic Series 4.5-Quart Tilt-Head Stand Mixer, Onyx Black

Ninja Foodi DZ401 DualZone XL Air Fryer, 10 Qt, 6-in-1, Grey

De'Longhi Classic Signature Espresso Machine with Adjustable Milk Frother
As an affiliate, we earn on qualifying purchases.
From System Monitor to Browser Tabs
The writer says she first noticed memory use through PowerToys Command Palette, after enabling PowerToys utilities to see which ones were active. The reported figure was consistently above 80% on a machine with 16GB of installed RAM. She also observed that the computer began freezing during tasks that had previously worked, including opening documents in LibreOffice and running Docker Desktop.
Task Manager was her usual first check, but its process totals did not account for the full picture she was trying to understand. The writer notes that installed RAM is not all available to applications, citing roughly 2GB reserved for hardware on her PC. She then compared views from Microsoft’s Process Explorer and Resource Monitor before using Brave’s process list to examine individual tabs. The account describes one person’s troubleshooting experience, not a controlled test of the tools or a diagnosis that applies to every Windows PC.
““my PC was consistently using over 80% of its 16GB RAM capacity””
— Megan, XDA Developers writer
What the Account Does Not Establish
The account does not identify the exact cause of the PC’s overall memory use, give a complete memory breakdown across all applications, or report a final measurement after every change. It says the browser was the main contributor and names a 1GB CMS tab, but does not specify how much memory every other tab or extension used, or whether the CMS page’s usage was unusual for that workload.
The writer reports finding no malicious processes in the tools she checked. That is a report about her investigation, not an independent security audit or proof that the PC was free of malware. The account also does not establish that Process Explorer, Resource Monitor or Brave’s task manager will identify the cause of high memory use on other systems. Hardware, installed software and workload can all differ.
Check Usage During the Next Freeze
The next step for a user seeing similar symptoms is to compare memory use while the slowdown is happening: inspect overall usage in Task Manager or Resource Monitor, check individual processes in Process Explorer, and open the browser’s own task manager if browser use appears high. Closing or disabling a confirmed heavy tab or unused feature can show whether it changes the reading. The XDA account does not report a further test, a lasting resolution, or a scheduled follow-up, so the PC’s longer-term performance remains unknown.
Key Questions
Does using more than 80% of RAM mean a PC has a problem?
Not by itself. The writer’s concern was the combination of high reported use and freezes during routine tasks. Memory percentage alone does not establish a fault or malware infection.
Why did Task Manager not explain the memory use?
In the writer’s case, Task Manager identified the browser as the largest user, but the apps she added together accounted for about 6GB. She also wanted a clearer view of hardware-reserved memory and the usage of individual browser tabs.
What did Process Explorer and Resource Monitor show?
Process Explorer provided another view of running processes and helped her spot Windows Resume using some memory. Resource Monitor displayed memory categories such as In Use, Standby and Free. She says neither revealed a malicious process.
How can I check which Brave tab uses the most memory?
Open Brave’s menu, choose More tools, then Task manager, or press Shift + Esc. The window lists memory use across tabs, extensions and browser tasks, according to the writer’s account.
Did the tools fully fix the writer’s PC?
The writer says she reduced usage into the 70% range by trimming some apps and features and identified a high-use browser tab. The account does not say that the PC’s freezes were permanently resolved.
Source: XDA Developers